SCIENCE
Paper 3 (Biology) - 2000
(One Hour and a half)
Question 5
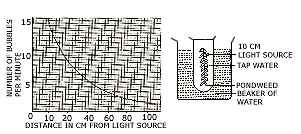
(b) The given diagram refers to an experiment in which the apparatus was set up with light source 10 cm away from the plant. After 15 minutes the number of bubbles evolved per minute from the cut stem was recorded. The light source was moved to 20 cm away from the plant for 15 minutes and the number of bubbles evolved per minute was again recorded. The experiment was repeated with the source of light at distances of 40, 60, 80 and 100 cm away from the plant. The result obtained were recorded on the graph. Select the correct answer out of the available choices given under each question.