Syvum Home Page

Home > Examinations > ICSE Board Class X Solved Exam Question Papers >

SCIENCE

Paper 3 (Biology) - 2000

(One Hour and a half)


Question 7
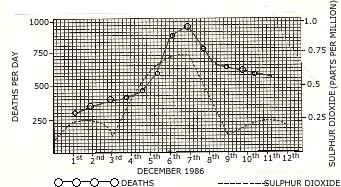
(b) The diagram given below refers to the following account of an investigation and a graph of the results obtained.
In 1986 a large city experienced a dense fog from 4th to 9th December. During this time there was an increase in the number of deaths. In answering the following questions use the graph which show how deaths per day were related to the amount of sulphur dioxide in the air. Select the best answer out of the five available choices given under each question.


Formats Worksheet / Test Paper Solve Exam Paper Review
: Fill in the blanks

Your Performance  

1.

(I) On which clay was the increase in sulphur dioxide greatest?
(i) 4th December
(ii) 5th December
(iii) 6th December
(iv) 7th December
(v) 8th December
 

2.

(II) How many deaths occurred on the day following the highest sulphur dioxide concentration ?
(i) 350
(ii) 575
(iii) 700
(iv) 875
(v) 925
 

3.

(III) The graph shows the deaths per day were not:
(i) lower before the fog than during the fog.
(ii) higher after the fog than before fog.
(iii) highest at the time of fog.
(iv) decreasing after fog.
(v) increasing throughout the fog.
 

4.

(IV) Clean air prevents the occurrence of fog. Which of the following will help to ensure a clean environment.
(i) air pollution
(ii) education
(iii) legislation
(iv) population control
(v) ventilation


131 more pages in ICSE Board Class X Solved Exam Question Papers

⇐ Skip and Go To Question 7(a) Dia...


Contact Info © 1999-2024 Syvum Technologies Inc. Privacy Policy Disclaimer and Copyright
Previous
-
Next
-